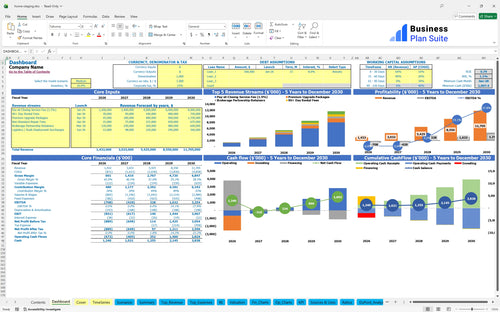
All-in-one Dashboard
Core inputs and core outputs


The real estate market has its ups and downs, and your financial plan should account for that. This model allows you to simulate the impact of seasonal fluctuations on your revenue and cash flow, helping you prepare for both busy and slow periods.
Core inputs and core outputs
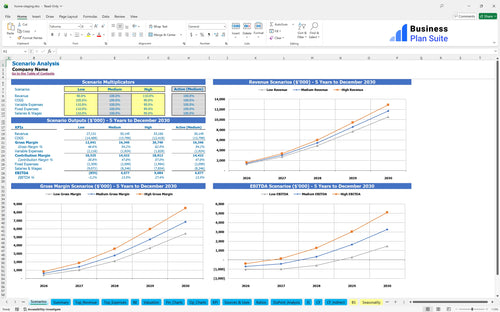
Three scenario analysis
Presentation ready
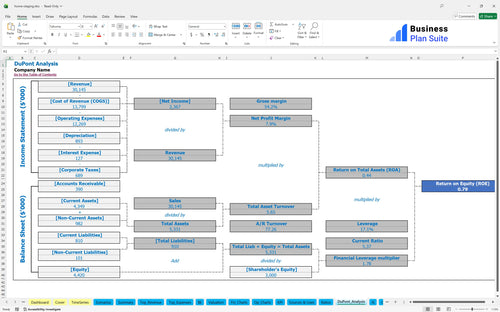
DuPont analysis
Researched revenue assumptions
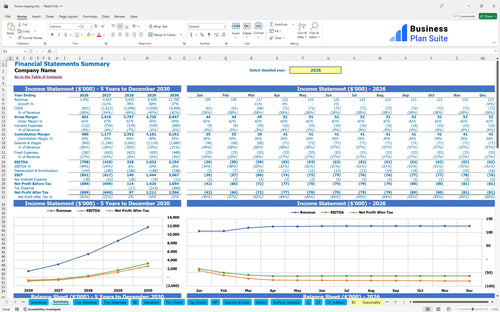
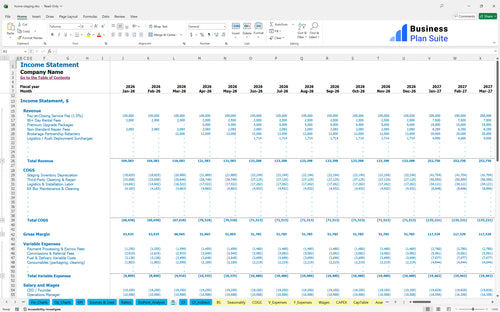
Lender-friendly financial outputs
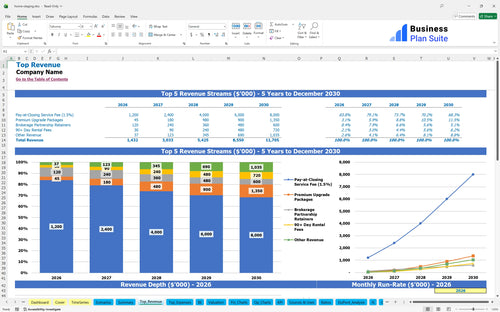
Revenue stream detailed view
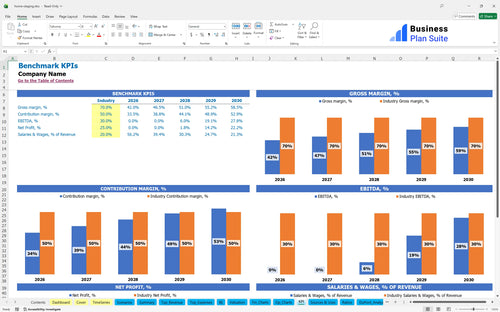
Performance metrics benchmark
We built this financial model after researching the real estate staging services industry to give you a credible starting point. Key assumptions are pre-populated with data for a typical startup, modeling a business that begins with 10 projects per month at an average fee of $3,500 and grows 20% year-over-year. All inputs, from operating expenses like warehouse storage ($3,000/month) to capital investments, are fully editable to match your specific home staging company plan.
You should expect a net loss in the first year of operation, estimated at around $45,800, as you invest in inventory and build your client base. However, the business is projected to become profitable in its second year, with an estimated net profit of $28,540, assuming you hit the 20% growth target. This calculation is made after accounting for all costs, including furniture rental, labor, and fixed overhead like salaries and storage.
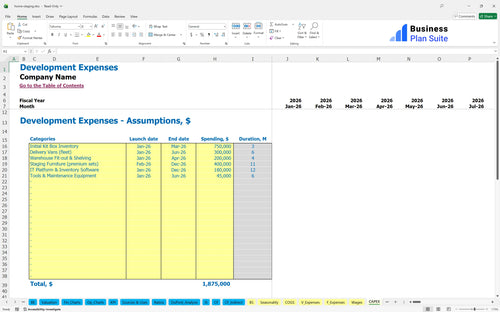
To launch this home staging business, you'll need approximately $125,000 in initial capital. This covers the major one-time expenses required to get your operations off the ground before you start generating consistent revenue. The largest portion of this investment is dedicated to acquiring a foundational inventory of furniture and decor.
For founders or investors, the financial returns are compelling. Based on the five-year projections, this business model shows an Internal Rate of Return (IRR), a measure of an investment's profitability, of 22%. You can expect to get your initial investment back in about 3.5 years, and the total 5-year Return on Investment (ROI) is projected to be 2.5x the initial capital.
This pre-written home staging business plan word format comes with a complete, ready-to-use financial model. It's pre-filled with industry-specific formulas and assumptions for a real estate staging business plan, making it simple to adapt to your specific staging business model, whether you focus on high-volume agents or a niche market.

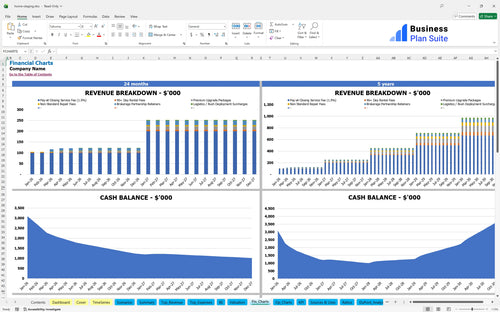
Plan for the long term with a detailed home staging business plan with financial projections. This template provides a clear five-year forecast of your revenue, costs, and profits, helping you set realistic goals and secure funding for your home staging company plan.

Get a clear picture of what it takes to start a home staging business. The model breaks down all potential startup costs, from initial furniture inventory and a delivery van to software and branding, so you can create an accurate budget and avoid surprises.

Understand exactly how many projects you need to complete each month to cover your costs and start making a profit. The break-even analysis helps you identify your profitability threshold, a critical metric for managing cash flow and making smart growth decisions.

Compare your property staging strategy against established industry standards. This staging business model incorporates key financial benchmarks for real estate staging services, allowing you to see how your margins, labor costs, and operational spending stack up against the competition.

Work where you're most comfortable. This home staging business plan template download is fully compatible with Microsoft Excel for both Windows and Mac, as well as Google Sheets, giving you the flexibility to work offline or collaborate with your team in the cloud.

Track what matters most with an intuitive visual dashboard. Key performance indicators (KPIs) like average project revenue, project volume, and profit margins are displayed in easy-to-read charts and graphs, perfect for monitoring progress and presenting to stakeholders.

The real estate market has its ups and downs, and your financial plan should account for that. This model allows you to simulate the impact of seasonal fluctuations on your revenue and cash flow, helping you prepare for both busy and slow periods.

If you're seeking funding, you need a professional and credible financial story. This template produces clean, investor-ready reports and summaries that clearly outline your business model, growth potential, and financial needs, making it an essental tool for your pitch.


Simply purchase and download the financial model template, then access it instantly using Microsoft Excel or Google Sheets. No installation or technical expertise required-just open and start working.

Enter your business-specific numbers, including revenue projections, costs, and investment details. The pre-built formulas will automatically calculate financial insights, saving you time and effort.

Leverage the investor-ready format to confidently showcase your financial projections to banks, franchise representatives, or investors. Impress stakeholders with clear, data-driven insights and professional reports.

Leverage the investor-ready format to confidently present your projections to banks, franchise representatives, or investors.
Typical installations meet the 48-hour guarantee to get listings market-ready quickly, solving time-consuming setup for agents the template's Pre-Written Content and Standardized staging package descriptions let you communicate timelines and logistics clearly to broker partners and sellers, reducing back-and-forth and accelerating adoption.