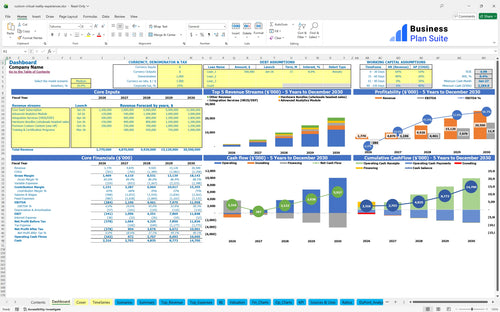
All-in-one Dashboard
Core inputs and core outputs


What happens if you land a major client early, or if SaaS adoption is slower than expected? This model lets you test different scenarios to see how changes in key assumptions impact your bottom line. It's a critical tool for a business plan for a VR risk reduction platform, helping you prepare for both risks and opportunities.
Core inputs and core outputs
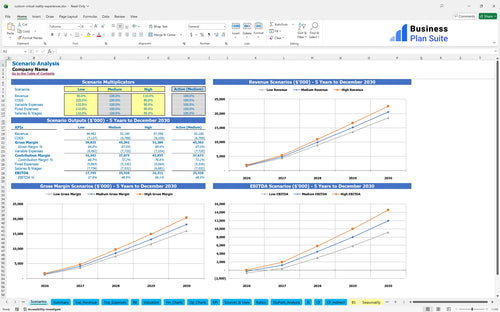
Three scenario analysis
Presentation ready
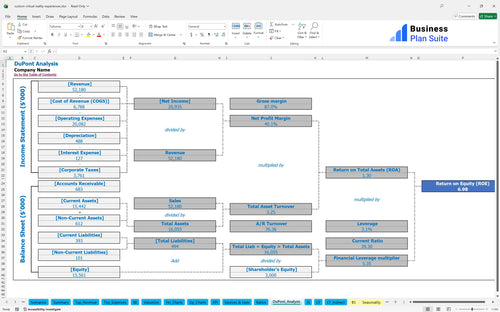
DuPont analysis
Researched revenue assumptions
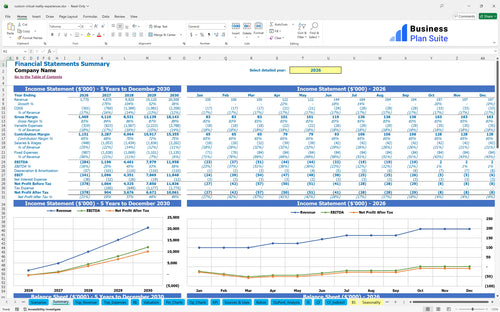
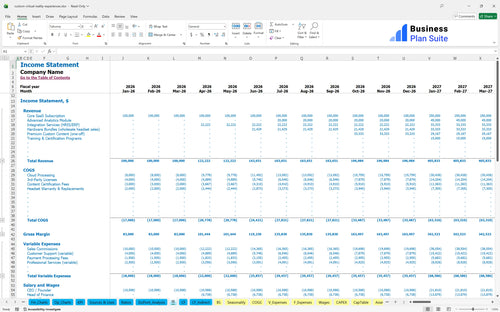
Lender-friendly financial outputs
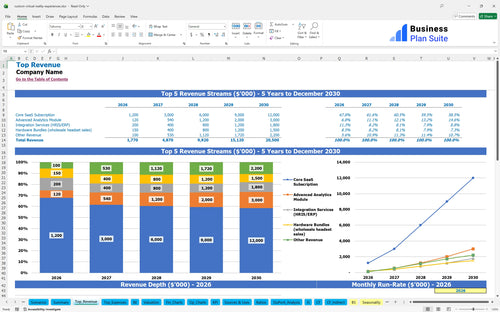
Revenue stream detailed view
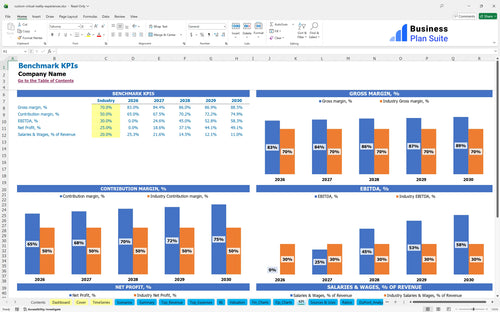
Performance metrics benchmark
We built this financial model based on extensive research into the custom virtual reality training space. Key assumptions for revenue streams like custom development projects (at $75,000 each) and tiered SaaS subscriptions ($500-$1,500/month), plus operating costs like developer salaries and marketing spend, are pre-populated with realistic industry data. This isn't just a blank slate; it's a data-driven starting point for your own VR venture, and every single number is defintely editable to fit your plan.
Profitability is within reach sooner than you might think. Based on our projections, the business turns a corner and becomes profitable in Year 3, generating a net profit of $213,200 after covering all operational costs and initial investments. The key is scaling the high-margin SaaS revenue while securing consistent custom development projects.
You don't need a massive venture round to get started. The total initial capital investment required to launch this business is $75,000. This covers all the essential one-time costs for hardware, software, and office setup to get your VR development studio operational from day one.
The financial returns are compelling for early investors. The model projects an Internal Rate of Return (IRR), which is the annualized rate of return on an investment, of 165%. With a payback period of just 3.5 years and a potential 142x multiple on the initial investment by Year 5, this presents a strong case for funding.
This VR training business plan template comes pre-filled with industry-specific formulas, so you can skip the setup and focus on strategy. It's designed for a custom virtual reality business plan, allowing you to easily adjust key inputs like project pricing, SaaS tiers, and operational costs to match your specific vision for providing immersive training solutions.

You need a long-term view to make smart decisions today. This model provides a complete 5-year forecast, detailing revenue, costs, and profits. It helps you build a credible virtual reality simulation business plan by projecting cash flow and valuation, giving you a clear roadmap from launch to scale for your corporate training technology venture.

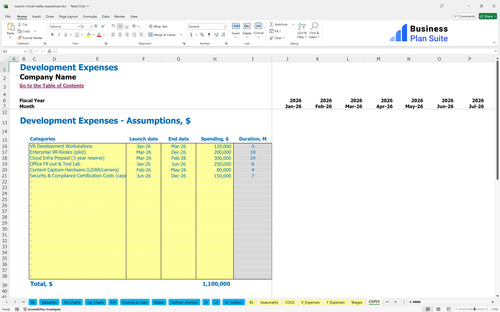
Understanding your cost structure is non-negotiable. This financial model provides a granular breakdown of all expenses required to launch and operate your industrial safety VR business. You can clearly see and edit everything from one-time capital expenditures to recurring monthly operational costs, which is essential for developing a business plan for immersive industrial safety.

Knowing your break-even point tells you the exact moment your business stands on its own two feet. This analysis calculates the sales volume needed to cover all your costs. For a business plan for virtual reality compliance training software, this means identifying the number of SaaS subscribers and custom projects required to achieve profitability, which our model shows is achievable in year three.

Operating in a vacuum is a recipe for failure. Our template for a VR safety simulation startup business plan allows you to track key performance indicators (KPIs) against industry standards. This helps you understand if your customer acquisition costs, lifetime value, and margins are competitive within the broader SaaS and workplace safety VR market.

Your tools should work the way you do. This customizable virtual reality safety training business plan is built to be flexible, fully compatible with both Microsoft Excel and Google Sheets. This ensures you can work on any device, collaborate with your team in real-time, and easily share your financials with advisors or investors.

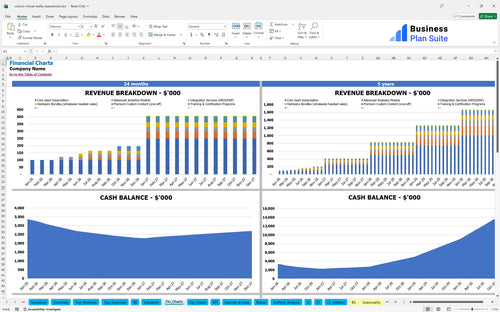
Investors and partners need to grasp your financial story quickly. The model includes a dashboard with clear, professional charts and graphs that visualize your key metrics. This makes it simple to present your sales trends, cost structures, and profitability projections from your business plan for an enterprise VR training solutions provider.

What happens if you land a major client early, or if SaaS adoption is slower than expected? This model lets you test different scenarios to see how changes in key assumptions impact your bottom line. It's a critical tool for a business plan for a VR risk reduction platform, helping you prepare for both risks and opportunities.

When you're asking for capital, you need to present with confidence. This pre-written business plan for a VR safety training company is formatted professionally, making it the perfect tool for your pitch. It provides the clear summaries, detailed financials, and polished reports that investors and lenders need to see before they'll write a check.


Simply purchase and download the financial model template, then access it instantly using Microsoft Excel or Google Sheets. No installation or technical expertise required-just open and start working.

Enter your business-specific numbers, including revenue projections, costs, and investment details. The pre-built formulas will automatically calculate financial insights, saving you time and effort.

Leverage the investor-ready format to confidently showcase your financial projections to banks, franchise representatives, or investors. Impress stakeholders with clear, data-driven insights and professional reports.

Leverage the investor-ready format to confidently present your projections to banks, franchise representatives, or investors.
Deployment time varies by scope, but you can rapidly reduce planning overhead using the pre-written content and customizable Word templates to get a working pilot in place this addresses the pain of high consultant costs by leveraging the Comprehensive Structure and Instant Download & Reuse features to accelerate setup without hiring external writers.